Web Application Monitoring
Client-side logging brings the great error management platform from the server, directly into the user's browser. All uncaught errors are automatically picked up and enriched with detailed information about the environment. Everything is shipped to elmah.io, where notifications, searching, and managing errors just work.
Errors can be stored in your existing or a dedicated client-side error log. In both scenarios both email notifications as well as our integrations to Slack and Microsoft Teams works out of the box. You already set up your organization and team members, why configuring who needs notifications on client-side errors, requires a few mouse clicks only.
Having both the client and the server's perspective will reduce the time you need to spend on bug fixing. Time that you will be able to spend on adding new features to your now zero-known-bugs product.
Event Logging
Chances are that you are already using some kind of logging framework like log4net, NLog, or Serilog on your server. Ever missed having the same possibilities on the client? With elmah.io's client-side logging, logging everything from verbose to fatal messages, is possible using our native JavaScript client.
Smart Grouping
Getting an overview of client-side errors, can be quite the pain. Take a look in the developer console when visiting your favorite websites and observe errors start to show. Browsers are experts in generating the same JavaScript errors over and over again.
With elmah.io's Smart Grouping feature, errors are bundled in groups, showing you the unique errors happening and the severity of each error. Unlike similar products out there, elmah.io logs every single error. This makes debugging a lot easier since you can browse through each error instance within a group, rather than looking at a simple counter.
Breadcrumbs
Figuring out why an error happened sometimes requires more than simply looking at the stack trace logged with all errors. In some scenarios, re-creating an error requires you to carry out the exact same actions as the user causing the error. This is where Breadcrumbs comes in.
elmah.io supports a powerful breadcrumb feature that will automatically pick up user actions and store them in memory. If an error is logged, the previous steps and actions are logged alongside the error. This creates the perfect overview of how the user caused an error to happen. Having the breadcrumbs will shorten the time you need to spend to find and fix JavaScript errors.
Device Insights
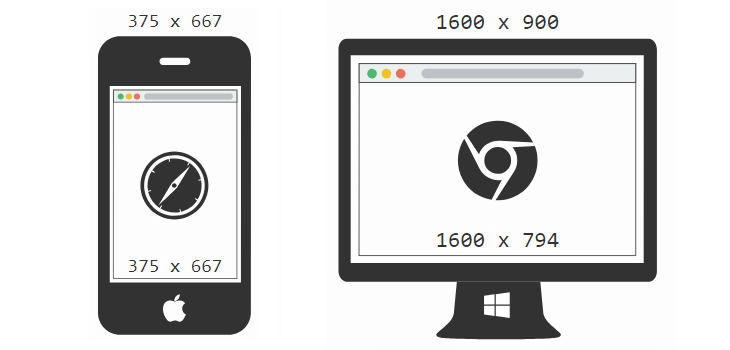
With elmah.io's Device Insights, you will receive detailed information about the environment generating the error. Being able to see if an error is generated from a desktop or mobile browser and even the orientation of the screen, will make it a lot easier to re-create an error.

Readable Stack Traces


You are already following good practices by bundling and minifying your scripts. While browsers will love you for doing that, the errors generated by your application won't. Bundled and minified stack traces, make it impossible to find the actual line of code causing an error.
With elmah.io for JavaScript, we automatically de-minify and de-bundle your stack traces, giving you a fair chance of spotting exactly where an error happened. By supporting de-minification through JavaScript Source Maps, we allow you to use whatever bundling and minification tool you like. No need to add additional tools to your build chain.
JavaScript Source Maps can either be deployed with your web application or uploaded to elmah.io to avoid revealing information about your original JavaScript and/or to reduce the size of the deployed package.