OpenTelemetry in the Cloud
The elmah.io exporter for OpenTelemetry stores the logs you already send through OpenTelemetry in elmah.io. Keep OpenTelemetry as your standard for logging, and add the exporter next to the ones you already have.
Logs in elmah.io are searchable, and your team is notified when a new error shows up. The exporter is a NuGet package, and it is currently released as a pre-release.
Attributes become properties
Every attribute on a log record is stored as a custom property that you can search by name. Attributes with a reserved name, like User, Url or Version, fill the matching field in elmah.io instead.
Trace context follows along. The trace ID is used as the correlation ID, and the span ID and trace flags are added as properties, so you can find all of the log messages from the same trace.
Enrich the messages
Add a service name and global attributes, like the environment, with the ResourceBuilder, and they follow every message. Turn on scopes to include a correlation ID or other values you add with BeginScope.
For anything else, the OnMessage hook gives you the message just before it is sent, and OnFilter lets you skip the messages you do not want to store.
Send what matters
Debug and information messages are useful in a console and expensive in a cloud service. Add a filter for the OpenTelemetry logger provider, and only warnings and errors are sent to elmah.io, while your other exporters get everything.
Fully documented
The documentation covers the setup, enriching messages with resource attributes, scopes and hooks, and filtering. The sample on GitHub is an ASP.NET Core application with the exporter set up.
Read the OpenTelemetry documentation or browse the sample on GitHub.
Let your AI agent read your OpenTelemetry errors
Connect Claude Code, Cursor, VS Code or Visual Studio to the elmah.io MCP server. Your agent can list new errors, read the stack trace and message details, check what changed after a deployment, and mark an error as fixed once you have shipped the change.
In Claude Code, add the server with one command:
claude mcp add --transport http --client-id claudecode elmahio https://mcp.elmah.io/mcpThe MCP server is included on every plan and is currently in beta. Set up the MCP server.
Set up in a few lines
Install the exporter, add it to the OpenTelemetry logging configuration in Program.cs with your API key and log ID, and add a filter to send warnings and up.
dotnet add package Elmah.Io.OpenTelemetry --prereleasebuilder.Logging.AddOpenTelemetry(options =>
{
options.AddElmahIoExporter(options =>
{
options.ApiKey = "API_KEY";
options.LogId = new Guid("LOG_ID");
});
});
builder.Logging.AddFilter<OpenTelemetryLoggerProvider>("*", LogLevel.Warning);The filter sends warnings and above only, which keeps debug and information messages from using your message quota. Your API key and log ID are shown on the install page when you sign up. Read the full setup guide.
How it looks
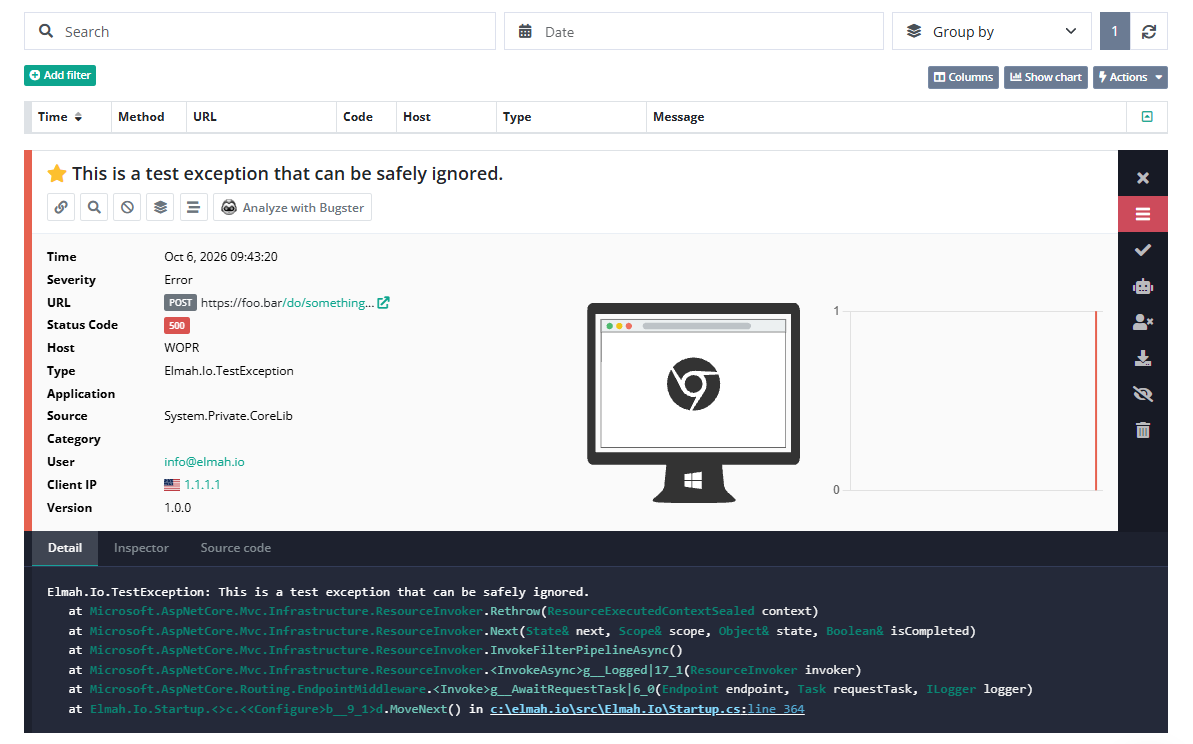
Here is what elmah.io logs for an OpenTelemetry log record:
- The message, with its severity and the logger category.
- The exception type and stack trace when the log record has an exception.
- Attributes, scope values and resource attributes as properties on the Data tab.
- The trace ID as the correlation ID, with the span ID and trace flags as properties.
Frequently asked questions
Does the exporter send traces and metrics?
No, the elmah.io exporter only sends log records, so keep the exporters you use for traces and metrics as they are.
Can I use it together with other exporters?
Yes. OpenTelemetry supports more than one exporter, so keep the one you have and add the elmah.io exporter next to it.
How do I avoid sending debug and information messages?
Add builder.Logging.AddFilter<OpenTelemetryLoggerProvider>("*", LogLevel.Warning). Only warnings and above are sent to the exporters of OpenTelemetry.
How do I add the environment or a service name?
Use SetResourceBuilder on the OpenTelemetry options. AddService adds a service name, and AddAttributes adds global attributes like deployment.environment. They are stored as properties on each message.
Is the package stable?
The package is released as a pre-release. Install it with the --prerelease flag, or reference it in your project file.
Can my AI coding agent read these errors?
Yes. Connect the elmah.io MCP server to Claude Code, Cursor, VS Code or Visual Studio. It is included on every plan and is currently in beta.